회귀분석
- 참조 : https://daryan.tistory.com/23
- sin() 함수를 그려보고, sin()함수에 난수를 더해 임의의 표본 생성
12345678910111213141516171819202122%matplotlib inline#문서내에 그래프 출력import numpy as npimport pylab as pldef f(size):x = np.linspace(0, 4.5, size)y = 2 * np.sin(x * 1.5)return (x,y)def sample(size):x = np.linspace(0, 4.5, size)y = 2 * np.sin(x * 1.5) + pl.randn(x.size)return (x,y)pl.clf()f_x, f_y = f(50)pl.plot(f_x, f_y)x, y = sample(50)pl.plot(x, y, 'k.')

- sklearn 모듈을 활용하여 선형회귀 : degree가 1이면 선형, 이상이면 n차 곡선이 그려짐
1234567891011121314151617from sklearn.linear_model import LinearRegressiondef fit_polynomial(x, y, degree): #x, y 분포에 적합한 다향식 추출model = LinearRegression()model.fit(np.vander(x, degree + 1), y)return modeldef apply_polynomial(model, x): #추출된 다항식에 x를 넣어 예측값 y를 구함degree = model.coef_.size - 1y = model.predict(np.vander(x, degree + 1))return ymodel = fit_polynomial(x, y, 4)p_y = apply_polynomial(model, x)pl.plot(x, y, 'k.')pl.plot(x, p_y,'g')
degree = 1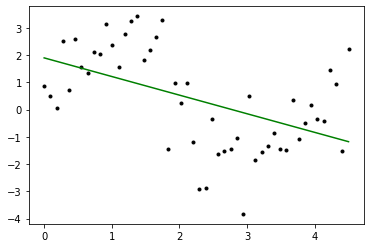
degree = 2
degree = 3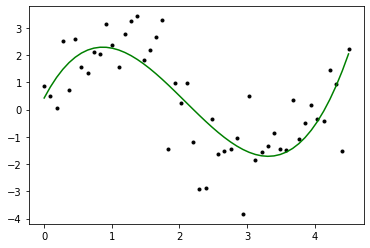
degree = 4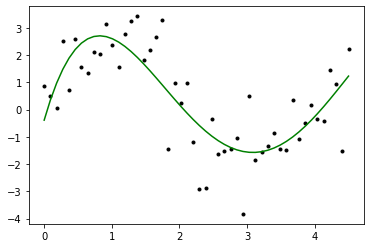
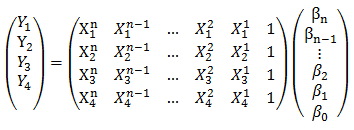
- numpy.vander() 함수 사용 예
12345#np.vander()함수 :x = np.array([4,2,7])print(np.vander(x, 4))print(np.vander(x, 6))